PI Vision The Ultimate Guide to Unlocking Data Insights
In a world driven by data, being able to visualize complex information clearly and intuitively is more important than ever. That’s where PI Vision steps in—an innovative data visualization tool developed by AVEVA (formerly OSIsoft) that empowers industries to monitor, analyze, and interact with real-time operational data. Whether you’re in oil and gas, utilities, manufacturing, or any data-heavy sector, PI Vision transforms raw data into actionable insights. This guide explores everything you need to know about PI Vision, from its features to implementation strategies, so you can unlock the full potential of your data.
click in link IT Office Relocation
Introduction to PI Vision
What is PI Vision?
PI Vision is a web-based data visualization platform that connects with the PI System to deliver powerful, real-time dashboards and graphics. Designed for operational intelligence, it enables users to create interactive visualizations of process data, helping organizations make faster, data-driven decisions.
At its core, PI Vision is about accessibility and clarity. Users can view data from any device, anywhere, without requiring specialized coding skills. Whether it’s a temperature sensor in a remote plant or a flow rate in a pipeline, you can see it all through intuitive, browser-based displays.
What makes PI Vision stand out is its ease of use. You don’t need to be an engineer or programmer to use it. Drag-and-drop functionality, seamless integration with PI Data Archive, and customizable displays allow both engineers and decision-makers to collaborate effortlessly.
The Evolution of Data Visualization Tools
Data visualization tools have come a long way—from static graphs in Excel to dynamic, interactive dashboards like those in PI Vision. The need for real-time analytics and user-friendly interfaces has driven this evolution. Traditional reporting systems often required heavy IT involvement and were limited in flexibility. PI Vision changed the game by enabling end-users to create and update visual displays on the fly.
Organizations now expect tools that allow them to act on insights instantly, and PI Vision delivers on that expectation. Its integration with the PI System means it’s not just about seeing data—it’s about interacting with it in real time, spotting trends, and predicting issues before they occur.
Key Features of PI Vision
Real-Time Data Monitoring
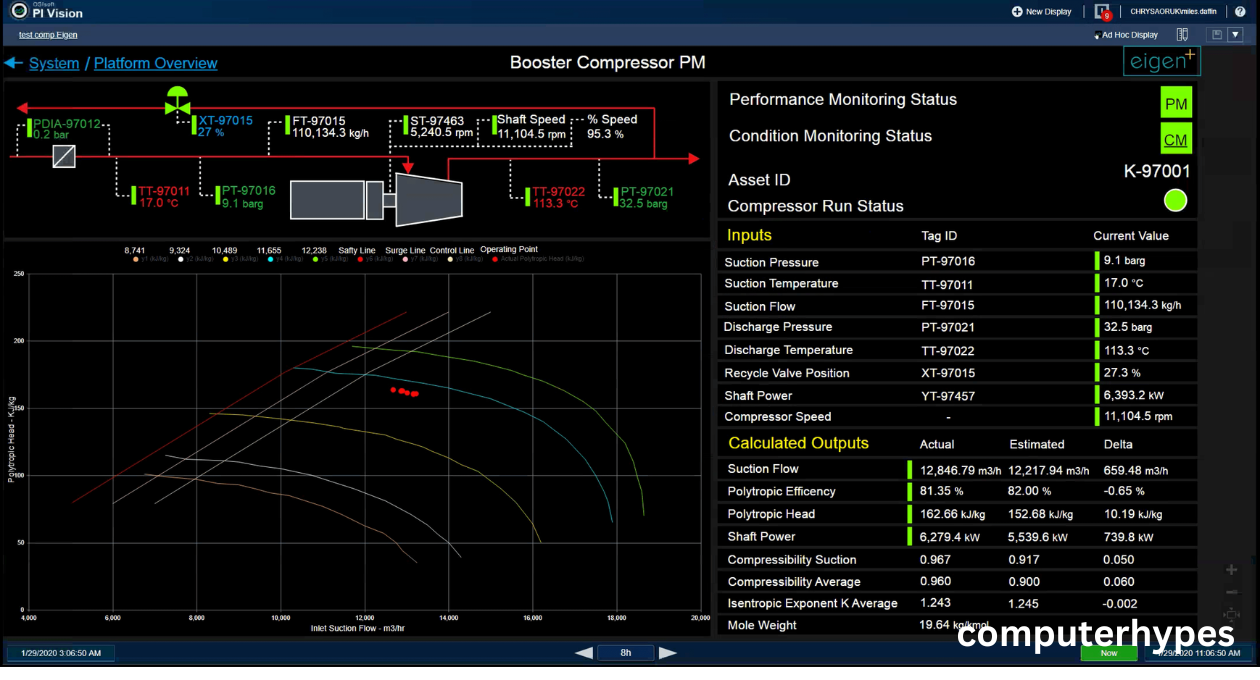
Real-time visibility is arguably the cornerstone of PI Vision. With the platform connected to the PI System, you can visualize live process data from thousands of assets and sensors across your operations. Whether you’re tracking pressure in a refinery or monitoring water levels in a reservoir, everything updates in real time.
This capability ensures that operators and engineers are always aware of what’s happening on the ground—no delays, no outdated reports. You can even set up alerts or display thresholds visually, enabling proactive maintenance and incident prevention.
Beyond simple graphs, PI Vision lets users overlay multiple data streams in one display, apply time-range sliders, and rewind or fast-forward through historical data. It’s like having a time machine for your process operations.
Custom Dashboards and Displays
Customization is another area where PI Vision shines. You’re not limited to generic templates. Users can design dashboards tailored to specific roles, processes, or departments. For example, a maintenance technician might build a display focused on equipment health metrics, while a plant manager might want production KPIs and energy usage.
You can arrange displays to show only the most critical information at a glance, use groupings to organize tags logically, and even link between displays for deeper drill-downs. This personalized approach leads to more efficient monitoring and faster decision-making.
Also, with role-based access, you can control who sees what, ensuring the right people get the right data without information overload.
Mobile Accessibility
The industrial world is increasingly mobile, and PI Vision keeps up with that trend. Its web-based architecture means it’s accessible from any device—desktop, tablet, or smartphone—without installing any software.
Whether you’re on-site, at a remote location, or halfway across the world, you can log in and view live dashboards. This makes PI Vision a powerful tool for remote monitoring and field operations, helping teams stay informed and reactive in fast-changing situations.
The responsive design ensures that all displays are readable and usable, even on smaller screens. And for added convenience, displays can be shared with a URL, making collaboration across teams and departments seamless.
click in link IT Office Relocation
Benefits of Using PI Vision
Improved Decision-Making
By providing real-time and historical data in visual formats, PI Vision enhances clarity and understanding. Decision-makers can spot anomalies, identify trends, and compare performance indicators quickly. No more waiting for end-of-week reports or juggling spreadsheets—information is always at your fingertips.
Imagine a production manager noticing a drop in output via a trend chart on their dashboard. Instead of guessing or waiting, they can investigate in real time, checking upstream metrics and pinpointing bottlenecks. That’s the kind of agility modern operations require.
Better decision-making isn’t just about speed—it’s also about accuracy. PI Vision’s displays help eliminate guesswork, enabling data-backed strategies and continuous improvement.
Enhanced Operational Efficiency
PI Vision does more than just show data—it helps optimize workflows. Engineers can set up visual cues for process limits, use calculated data (like averages or efficiency metrics), and track asset performance over time. This leads to proactive maintenance, reduced downtime, and smoother operations.
Think of it as having a digital control center where everything you need is visible in one place. You can identify underperforming units, spot unusual energy usage, and monitor compliance—all in real time.
With fewer surprises and faster reaction times, operations run more smoothly and cost-effectively. That translates to better bottom-line results.
Seamless Integration with PI System
One of PI Vision’s strongest points is its tight integration with the rest of the PI System, including PI Data Archive and Asset Framework. This means all your operational data—historical and real-time—is available and organized for easy access.
You don’t need to extract or reformat data manually. Everything connects smoothly, so users can focus on analyzing and acting rather than managing data logistics. It also supports external data sources and third-party integrations, offering even more flexibility.
With this unified data ecosystem, organizations can create holistic views of operations—from raw input to final output—all in one tool.
Getting Started with PI Vision
System Requirements and Installation
Setting up PI Vision is fairly straightforward, but there are a few key system requirements to keep in mind. It runs on Windows Server, typically in an enterprise environment. You’ll need:
- A supported version of Windows Server (2016 or later)
- Microsoft IIS (Internet Information Services)
- A connection to a PI Data Archive and Asset Framework server
Once the server-side components are configured, the web application is accessible through any modern browser (Chrome, Edge, Firefox, etc.).
The installation package includes a setup wizard that guides you through configuration, including data source connection, security settings, and user access roles. For a seamless experience, it’s best to coordinate with your IT team to handle firewall rules and SSL certificates properly.
Building Effective Dashboards
Best Practices for Visual Layout
Creating a dashboard isn’t just about displaying data—it’s about doing it intelligently and clearly. PI Vision offers a range of symbols, charts, and layout tools, but it’s up to the user to apply design principles that make the data easy to interpret.
Here are a few tips for effective layouts:
- Keep it clean: Avoid clutter. Group related elements and use whitespace wisely.
- Use color meaningfully: Red for warnings, green for normal operations, etc.
- Prioritize: Place the most critical information top and center.
- Label everything clearly: Ambiguous symbols can confuse users unfamiliar with the context.
Also, consistency across displays helps users feel oriented when switching between screens. Use templates and consistent naming conventions for an organized experience.
click in link IT Office Relocation
Faqs
1. What industries benefit the most from PI Vision?
PI Vision is highly versatile and used across many industries, especially those that rely on continuous operations and real-time data monitoring. These include oil & gas, utilities, manufacturing, energy, water treatment, and pharmaceuticals. Any organization with assets and processes to monitor can benefit from its capabilities.
2. Can I access PI Vision on mobile devices?
Yes, PI Vision is fully web-based and mobile-friendly. You can access dashboards and displays from any device with a web browser, including smartphones and tablets. Its responsive design ensures a smooth experience even on smaller screens, making it ideal for remote monitoring and fieldwork.
3. How secure is PI Vision for enterprise data?
PI Vision follows strict enterprise-grade security protocols. It integrates with Windows Authentication and Active Directory, enabling secure user and role-based access. Organizations can control who views or edits specific displays, ensuring data confidentiality and operational safety.
4. Is coding required to build dashboards in PI Vision?
Not at all. PI Vision is designed with a user-friendly, drag-and-drop interface that requires no coding knowledge. Engineers, operators, and analysts can build and customize dashboards quickly, enabling faster adoption across teams with varying technical skills.


Post Comment